Results: detailed view
When the job finishes, the files are placed in the  Results
folder, accessible via the home panel.
Results
folder, accessible via the home panel.
Click on an image result for further inspection as explained in Results .
The detailed view shows the following information:
- MIP of original vs deconvolved,
- SFP of original vs deconvolved,
- Z Slicer of original vs deconvolved,
- T Slicer of original vs deconvolved,
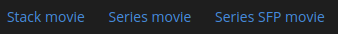
- Stack movie of deconvolved,
- T movie of deconvolved,
- T SFP movie of deconvolved,
- Colocalization results,
- Parameter summaries,
- Huygens log.
Note
The number of tools shown in the detailed view depends on the type of restoration, the image geometry and the HRM configuration.
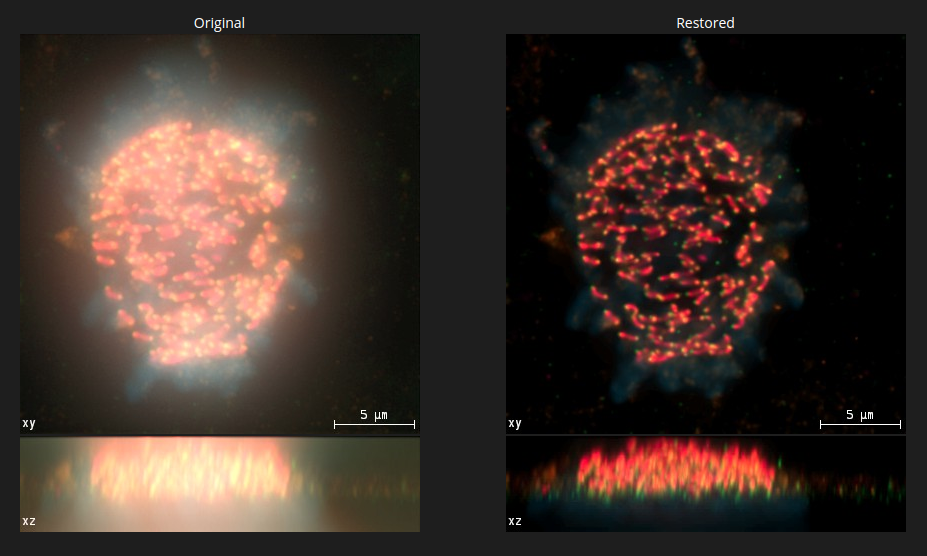
Comparing MIPs
A comparison of the Maximum Intensity Projections of the raw image and the restored image shows the effect of deconvolution. This can be assessed in both XY and XZ projections.
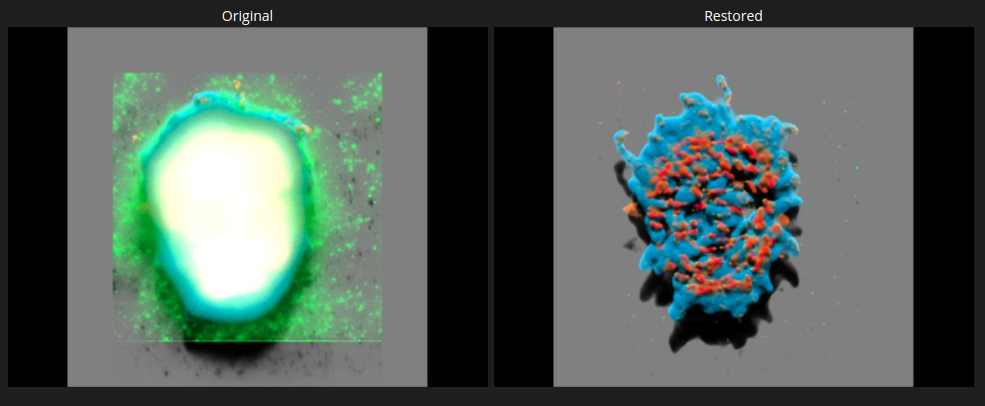
Comparing SFPs
A comparison of the Simulated Fluoresence Process in both the raw image and the restored image also shows the effect of deconvolution and difference in noise.
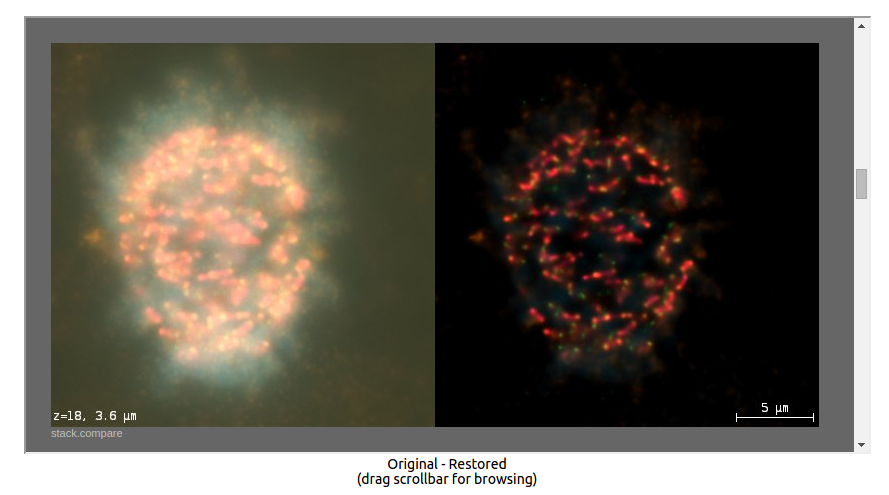
Comparing Z Slices
The slicer allows for a comparision of the raw image and the restored image slice by slice along the Z direction at any depth.
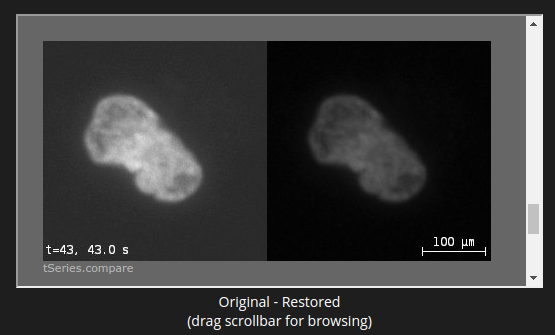
Comparing T frames
The time slicer allows for a comparision of the raw image and the restored image frame by frame.
Z, T and T-SFP movies
Click on the corresponding links to download any of the movies to your local computer.
Note
These automatically made movies are quite useful for prepraring presentations.
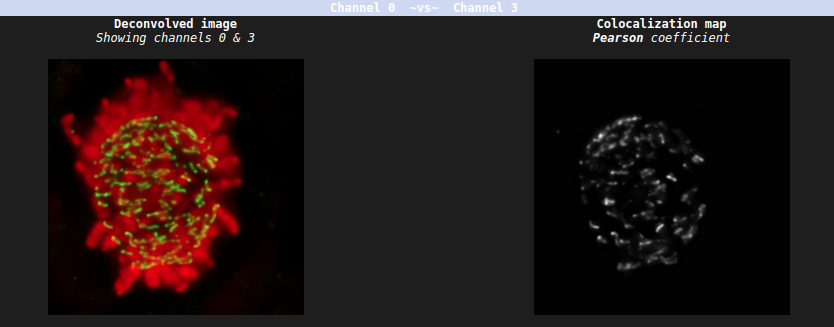
Colocalization
The selected colocalization coefficients of each two channels are listed in a table with an entry per frame.

Also, 2D histograms show the correlations between any two channels.
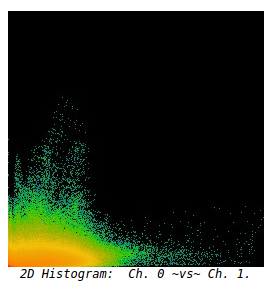
Lastly, the colocalization maps show the regions where colocalization between any two channels is strongest.
Parameter summaries
HRM also gives feedback on all the parameter values used during deconvolution. This is particularly useful when the parameters are read from the image metadata.
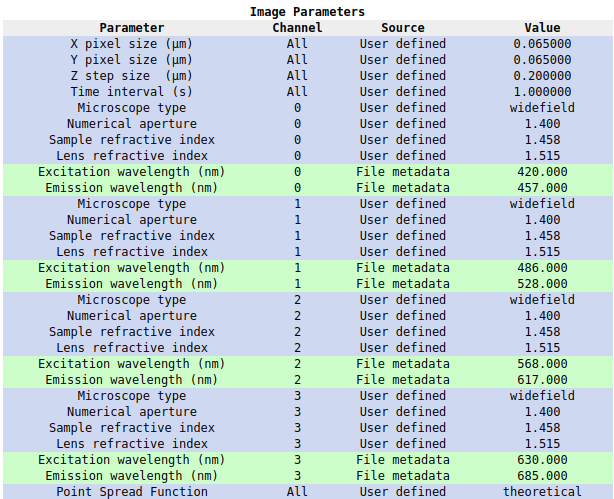
Notice that green entries indicate parameters loaded from the image metadata, whereas violet entries indicate parameters defined by the user.
If the image had to be scaled to fit in the output file format (some formats have very limited dynamic ranges) HRM will show the scaling factors for further quantification:

Huygens log
The exact steps followed by Huygens to process the data can be found on the
Huygens log, under the link  .
.
Note
All these results can be donwloaded along with the deconvolved
dataset by clicking  at the top of the page.