Analysis Template#
An analysis parameter template consists of a number of options that provide Huygens Core with information about the type of analysis to execute on the images. To get a preview of the template contents select the template, the contents will be displayed on the right panel.
Note
When editing a template help links  are displayed at
key locations to point you to specific articles of the SVI-wiki.
are displayed at
key locations to point you to specific articles of the SVI-wiki.
Colocalization#
Colocalization is a type of analysis which measures the amount of overlap between the objects of two channels.
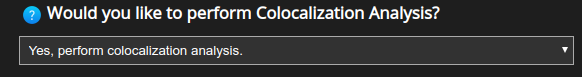
Here simply select whether or not colocalization analysis should be performed after deconvolution.
Note
Colocalization can only be performed on multichannel images.
Channels#
Select the channels to be analyzed.
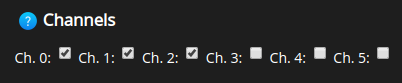
All the combinations of the selected channels will be studied. For example, the selection shown in the figure above will result in the analysis of the following channels:
0 and 1,
0 and 2,
1 and 2.
Colocalization coefficients#
HRM can report all the colocalization coefficients that are most widely used in fluorescence microscopy.
Select here the colocalization coefficients for the analysis:
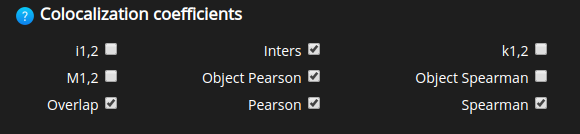
A colocalization report with all these findings will be ready when the job is finished.
For further information on specific colocalization coefficients please read this article from the SVI wiki.
Threshold#
In order to discard background signals from the colocalization analysis it is possible to set a threshold level.
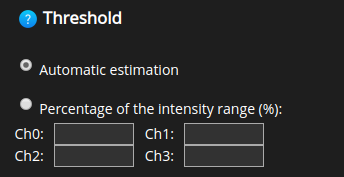
The automatic option typically works well for most purposes. Yet, it’s possible to specify a threshold per channel to discard particular features of each colour.
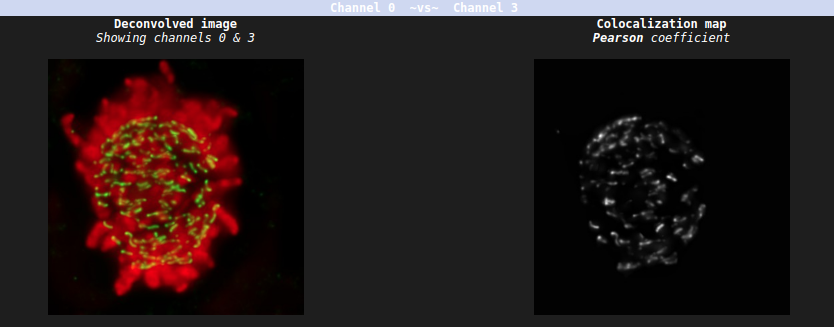
Colocalization map#
While a colocalization coefficient quantifies the level of overlap between two whole channels, a colocalization map displays the value of a specific colocalization coefficient for each voxel of the two channels.
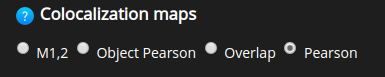
Therefore, a colocalization map is a 3D image of the level of overlap between the two channels, according to a specific coefficient.
It is possible to choose between the 4 most widely used colocalization maps. The maps will be displayed in the colocalization report after the job is finished.
Note
The colocalization maps help us to assess the colocalization regions visually.
As an example the below figure shows the deconvolution result of channels 0 and 3 next to the colocalization map (Pearson coefficient) of the same channels.